Figure 7.

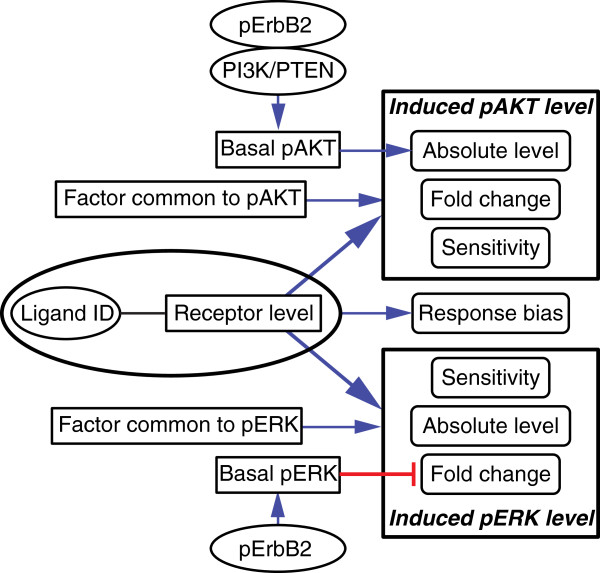
Flow chart of dependencies between basal levels and induced levels. This is a heuristic summarizing the primary determinants of cellular response to ligands at the level of pAKT and pERK. See text for details.

Flow chart of dependencies between basal levels and induced levels. This is a heuristic summarizing the primary determinants of cellular response to ligands at the level of pAKT and pERK. See text for details.