
Figure 2.
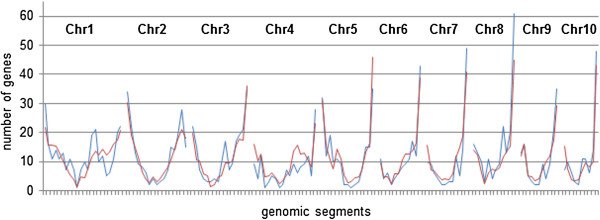
Gene distribution of MPH-correlated genes across the ten chromosomes of the maize genome (B73). The figure shows the number of MPH-correlated genes per genomic segment (blue lines). The red lines show the average number of random genes per genomic segment as calculated from bootstrap analysis. Significant difference between the two gene distributions was shown by a chi-square test (χ2 (df = 144, n = 1654) = 183.84, p = 0.014).