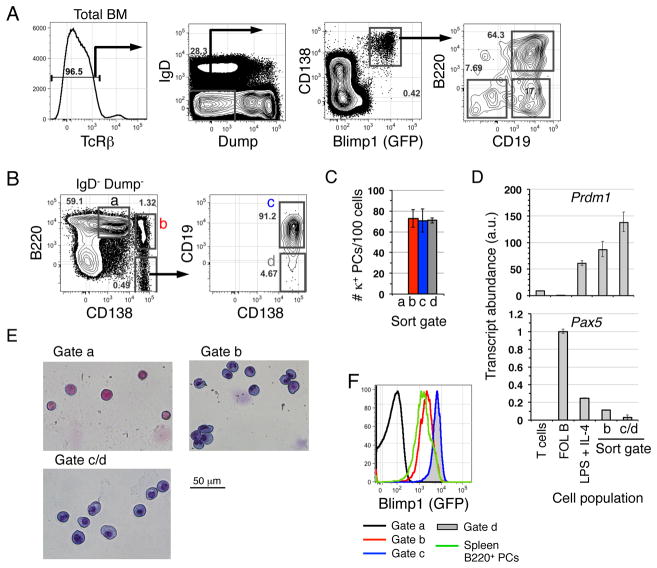
Figure 1. Resolution of three populations of BM PCs.
(A) BM cells from an 8-week-old female B6.Blimp1+/GFP mouse were stained with the indicated antibodies before analysis of 2 × 10⁶ events. The left-most plot is pre-gated on DAPI− cells. Arrows indicate each successive gate. “Dump” antibodies were F4/80, Gr-1, Ter-119, CD4, and CD8α. Representative of four separate analyses. (B) BM cells from an 8-week-old female B6 mouse were stained and analyzed as in (A). Representative of ten separate analyses. (C) Cells from the indicated populations were sorted and added in triplicate to ELISPOT plates coated with anti-mouse Igκ antibodies. Representative of two separate experiments. (D) cDNA prepared from CD3+ T cells, splenic CD23+ follicular (FOL) B cells, FOL B cells stimulated with LPS + IL-4 for three days, or cells within the indicated BM PC subsets (B) were sorted from adult B6 mice and subjected to RT-PCR using Taqman probes for Blimp1 (Prdm1), Pax5, or GAPDH. Resulting signals were normalized to FOL B cells. (E) Cells were sorted from adult B6 mice using the gates shown in (B) and stained eosin and hematoxylin as described in Methods. (F) BM or spleen cells from an 8-week-old female B6.Blimp1+/GFP mouse were stained as in (B), and relative GFP expression determined using the gating strategies shown in (B) and summarized in the legend below.

