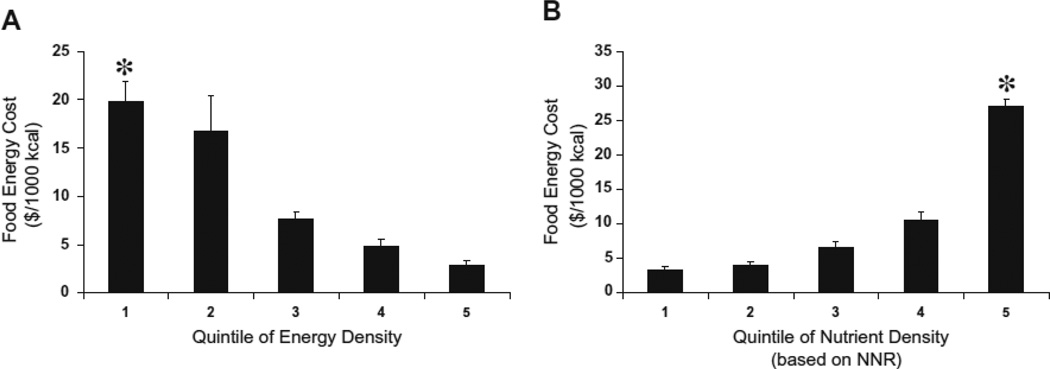
Figure 2.
Food energy cost ($/1000kcal), by quintile of energy density (A) and nutrient density (NNR score; B) for all foods and beverages (n=378). Prices were based on 2008 Seattle-area retail prices. Higher energy density was associated with significantly lower food energy costs while higher nutrient density was associated with significantly higher food energy costs (* indicates different at p<0.001).

