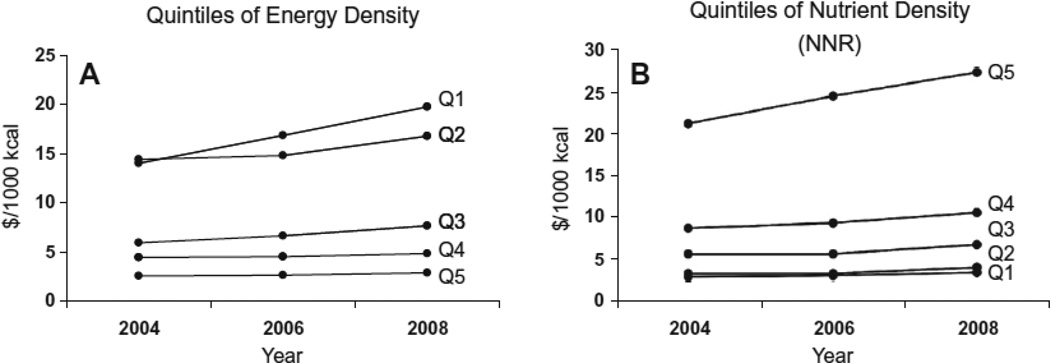
Figure 4.
Secular trends in retail food prices over four years, with foods stratified into quintiles of energy density (A) or nutrient density (B) of all foods and beverages. Curves show mean food energy costs ($/1000 kcal) for each quintile of over the four years of the study. Lowest energy density foods showed the sharpest rise in prices. Likewise, high nutrient density foods (based on NNR) showed the highest inflation rate between 2004 and 2008. The inflation rate for the highest nutrient density group at 29.2% compared to 15.9% for the foods in the lowest nutrient density quintile.

