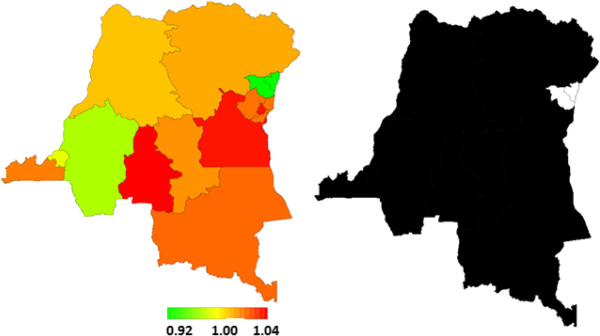
Figure 3.

Total residual spatial effects of child survival and corresponding posterior probabilities at 80% nominal level by province. Left: Total residual spatial effects of child survival at province level in the DRC. Posterior odds ratio is shown. Right: Corresponding posterior probabilities at 80% nominal level; that is the level of confidence we have in the results, illustrated as a colour scale: white denotes provinces with strictly negative credible intervals (lower mortality), and black denotes provinces with strictly positive credible intervals (higher mortality).
