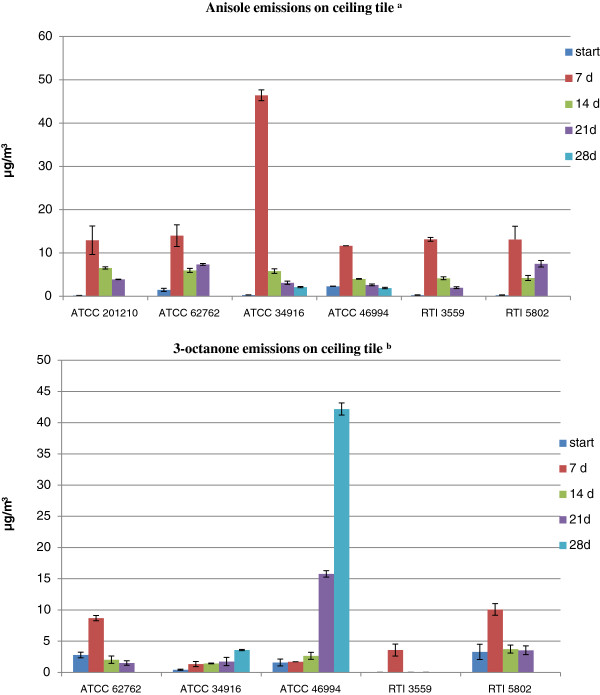
Figure 3.

Anisole and 3-octanone emissions on ceiling tile. The bar graph shows the mean ± SD of anisole and 3-octanone emissions for six independent Sc strains growing on ceiling tile. a.S. chartarum ATCC 208877 MVOCs emissions not tested on ceiling tile; b. 3-octanone emissions for S. chartarum ATCC 201210 below detection limit.
