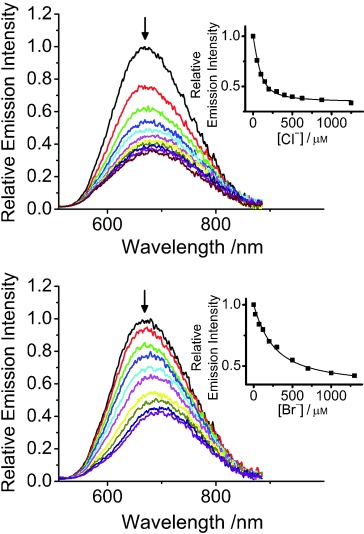
Figure 1.

Changes in the emission spectra of 1 (100 μm) in acetonitrile (0.1 m nBu4NPF6) upon addition of nBu4NCl (top) and nBu4NBr (bottom). Insets: plot of relative emission intensity at 667 nm against various concentrations of Cl− and Br− ions and their theoretical fit for 1:1 binding stoichiometry.
