
Figure 4.
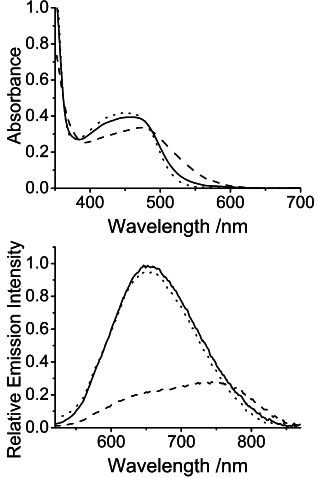
Changes to the UV-vis absorption (top) and emission (bottom) spectra of 2 (100 μm) (solid line) in acetone (0.1 m nBu4NPF6) in the presence of nBu4NF (4 equiv) (dashed line), and in the mixture in the presence of trifluoroacetic acid (4 equiv) (dotted line).