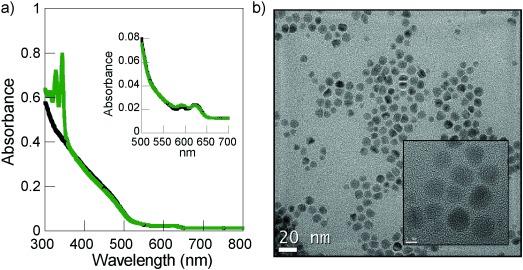
Figure 2.

a) Comparison between the absorption spectrum of a THF solution of CS (—) and CS@Py (—), nanoparticle concentration: 40 nm; inset: enlargement of the CS@Py spectrum between 500 and 700 nm. b) HRTEM image of CS@Py, scale bar of 20 nm; inset: image with scale bar of 5 nm.
