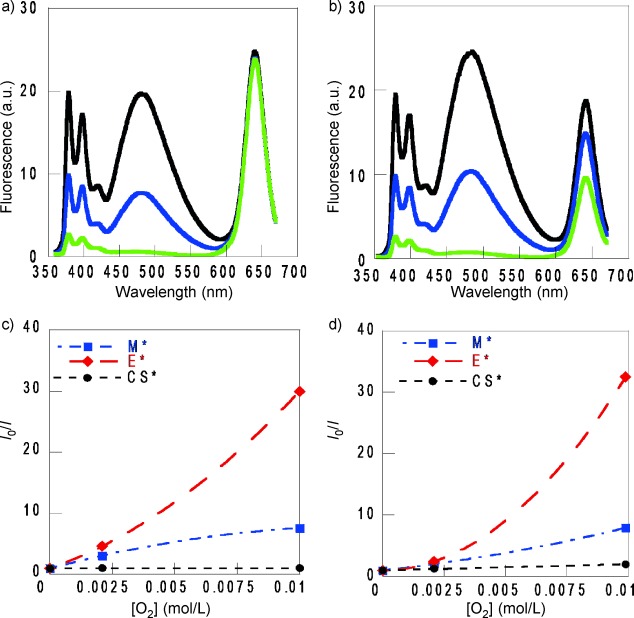
Figure 4.

Emission spectra of CS@Py at λexc=340 nm (A340=0.15) in a) THF and b) toluene in the presence of increasing [O2]: the deaerated sample (—), the aerated sample (—) and the O2 saturated sample (—). I0/I dependence of [O2] for M*, E* and CS* of CS@Py in c) THF and d) toluene.
