
Figure 4.
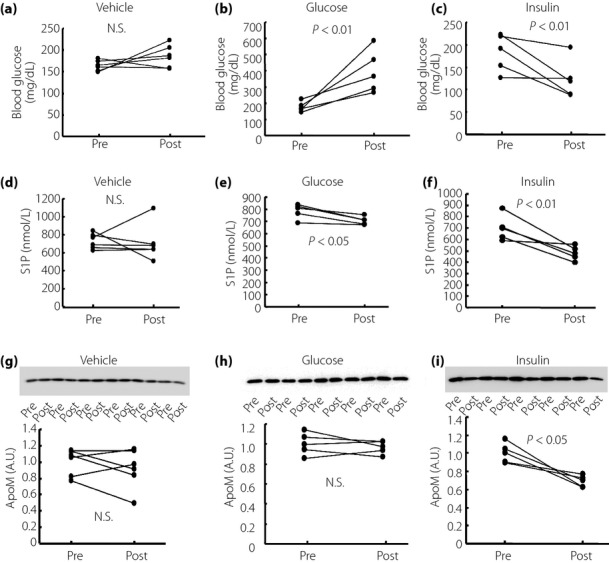
The effects of insulin and glucose on plasma sphingosine-1-phosphate (S1P) and apolipoprotein M (ApoM) levels in normal mice. Ten-week-old normal mice were treated with Humulin R (0.5 IU/kg of bodyweight), glucose (2 g/kg of bodyweight) or phosphate-buffered saline (n = 5–6/group). Before and at 2 h after the administration, the plasma and liver samples were collected and used to measure the S1P and ApoM levels. (a–c) Changes in the blood glucose level, (d–f) changes in the plasma S1P level and (g–i) changes in the plasma ApoM level. A.U., arbitrary unit; N.S., not significant.