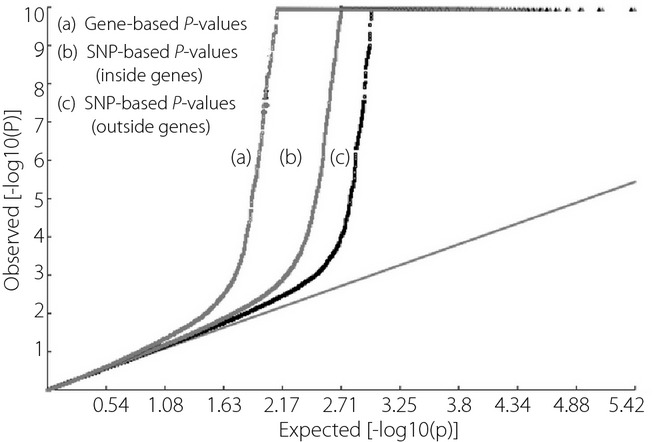
Figure 1.

Q–Q plot of P-values. There are three quantile–quantile plots of the observed P-value distributions. As compared with the expected null P-value distributions, the tail of the distribution for gene-based P-values is the most significant deviation. SNPs, single-nucleotide polymorphisms.
