Figure 1.

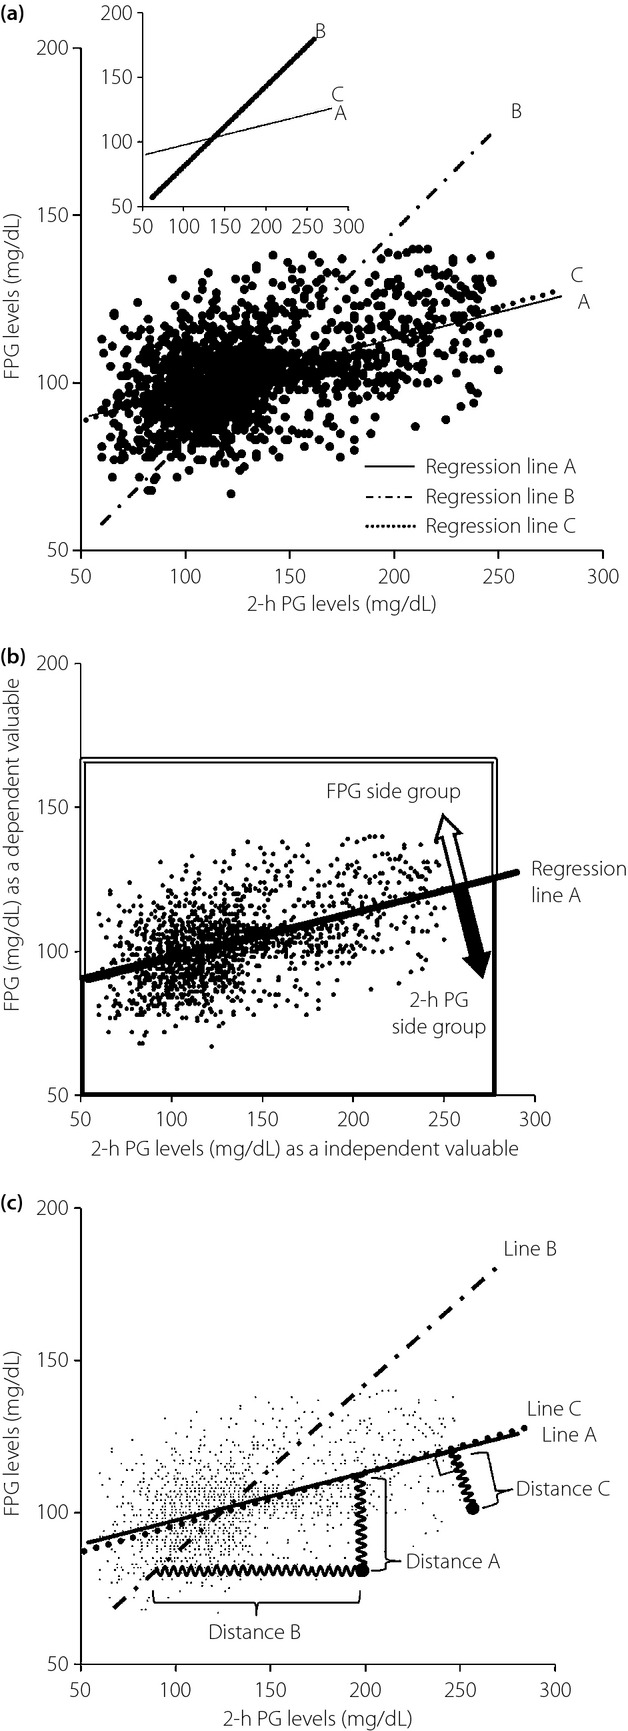
(a) Simple linear regression analysis between 2-h plasma glucose (PG) and fasting plasma glucose (FPG) levels. The solid line (regression line A) indicates a regression line of 2-h PG levels as an independent variable, obtained by the least squares method minimizing the residual sum of squares; sum of distances from the regression line in parallel with the y-axis (y = 0.16x + 81.70). The dashed-dotted line (regression line B) indicates a regression line of FPG levels as an independent variable, obtained by the least squares method minimizing the sum of distances from the regression line in parallel with the x-axis (y = 0.62x + 20.80). The dotted line (regression line C) indicates a regression line of both 2-h PG and FPG levels as independent variables, obtained by the least squares method minimizing the sum of vertical distances from the regression line (y = 0.17x + 80.11). (b) Grouping of participants according to regression line A. The plots located below regression line A belong to the FPG side group, and the plots located above regression line A belong to the 2-h PG side group. According to the position of the plot, the plot located above the regression line belongs to the FPG side group shown by the large open arrow surrounded by a double line; in contrast, the plot located below the regression line belongs to the 2-h PG side group shown by the large closed arrow surrounded by a heavy line. (c) The view illustrates a frame format to show the method for regression line A, line B and line C. Setting the regression line by the least squares method means that the attracting force proportional to the distance from the each plots represents the strength (drawing power) of the spring. Distance A means the distance from regression line A in parallel with the y-axis, distance B means from regression line B in parallel with the x-axis and distance C means the vertical and shortest distance from regression line C.
