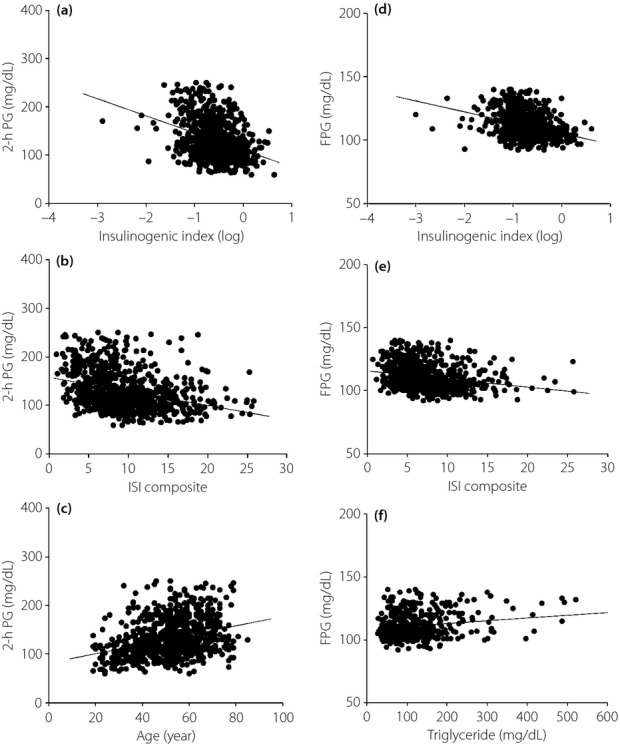
Figure 2.

(a) The relationship between insulinogenic index (log) and 2-h plasma glucose (PG) in the 2-h PG-side group (r = −0.348, P < 0.0001). (b) The relationship between insulin sensitivity index (ISI) composite and 2-h PG in the 2-h PG-side group (r = −0.328, P < 0.0001). (c) The relationship between age and 2-h PG in the 2-h PG-side group (r = 0.329, P < 0.0001). (d) The relationship between insulinogenic index (log) and FPG in the FPG-side group (r = −0.347, P < 0.0001). (e) The relationship between ISI composite and FPG in the FPG-side group (r = −0.236, P < 0.0001). (f) The relationship between triglyceride and FPG in the FPG-side group (r = 0.206, P < 0.0001).
