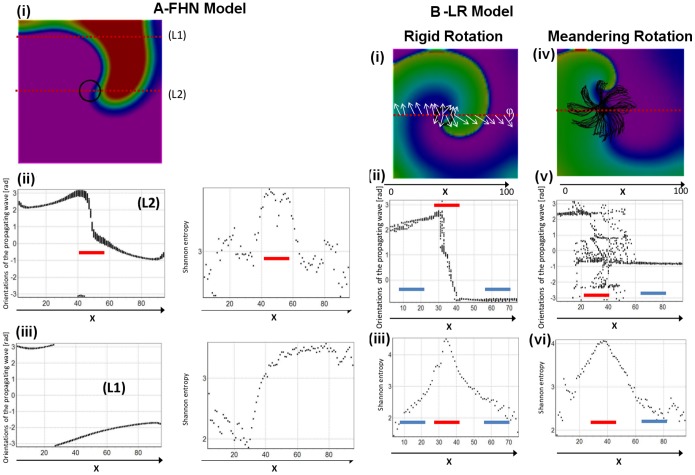
Figure 2. High ShEn at the pivot occurs as a consequence of variable wavefront direction.
A. FHN model spiral wave. Panel (i) shows a snapshot from a FHN spiral wave. The trajectory of the spiral wave tip (circle) is shown. The location of meridian lines L1 (which passes through the periphery) and L2 which is at the pivot are shown. In Panel (ii), (iii) left the orientation of wavefront angle (ψ) in radians are shown along L1 and L2. It can be seen that there is a narrow distribution of wavefront angles at the periphery (blue bars), but at the pivot a broad distribution of angles is seen (red bar). This broad distribution of wavefront angles leads to high ShEn at the corresponding region of the pivot (red bar, right upper panel). B. LR spiral wave shown for rigid rotation (where Gsi = 0.00) and meandering rotor (Gsi = 0.43). In the rigid rotation case, it can be seen that at the periphery (blue bars), there is a narrow distribution of wavefront directions, and low ShEn at the periphery. In contrast, at the pivot, there is a broad distribution of wavefront angles (red bar), and high ShEn. Similarly, in the meandering case, there is a broad distribution of wavefront angles (red bars), corresponding to the region of high ShEn.

