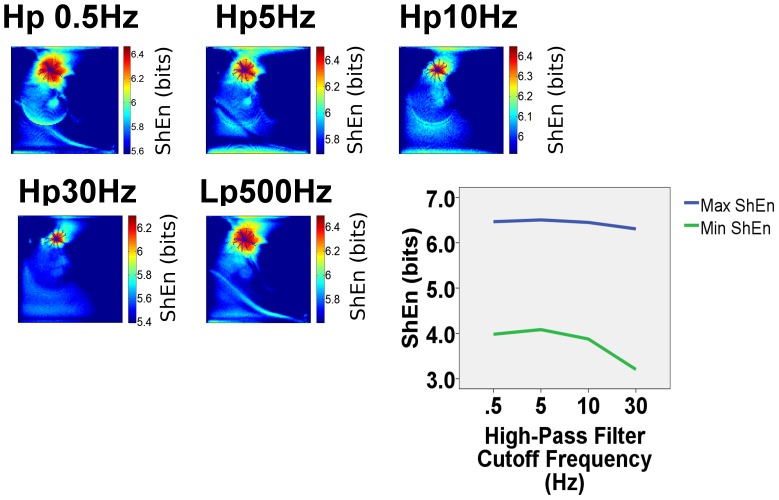
Figure 5. Effect of Filtering on ShEn maps of the CRN rotor.
EGMs in the electrophysiology laboratory typically undergo high-pass and low-pass filtering. The effects of simulated Butterworth high-pass (hp) and low-pass (lp) are shown. ShEn maps in the CRN model rotor are shown simulating high pass filters with at 0.5Hz, 5 Hz, 10 Hz and 30 Hz (typically used in the electrophysiology laboratory). It can be seen that the common area of maximum ShEn occurs in each map, in the area overlying the tip of the spiral wave trajectory. Low-pass filtering at 500 Hz has minimal effect on the distribution of ShEn.

