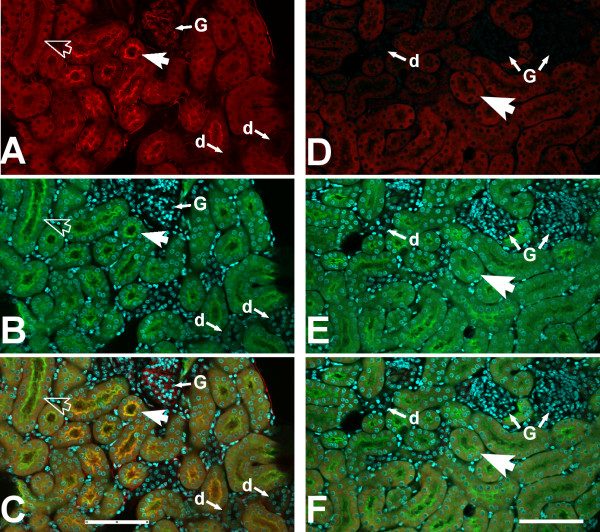
Figure 1.

Immunolocalization of CLIC4 in mouse kidney, low power images. Vibratome sections of mouse kidney stained with antibody to CLIC4 (red) plus markers for the proximal tubule brush border (LTA, green), and nuclei (DAPI, cyan) were observed with a 20× objective under confocal microscopy. The panels on the left (A-C) are from a WT mouse, the panels on the right (D-F) are from a Clic4 null mouse. A and D: CLIC4 signal. B and E: Merged LTA (green) and DAPI (cyan) signals. C and F: Merged image with all signals. The large arrows indicate proximal tubules, identified by brush border staining with LTA. In panels A-C, the solid large arrow indicates a LTA-positive proximal tubule that shows apical staining for CLIC4; the open large arrow indicates a LTA-positive proximal tubule that does not show apical CLIC4 staining. Glomeruli are designated G, distal (LTA-negative) tubules are designated d. The scale bar represents 100 microns.
