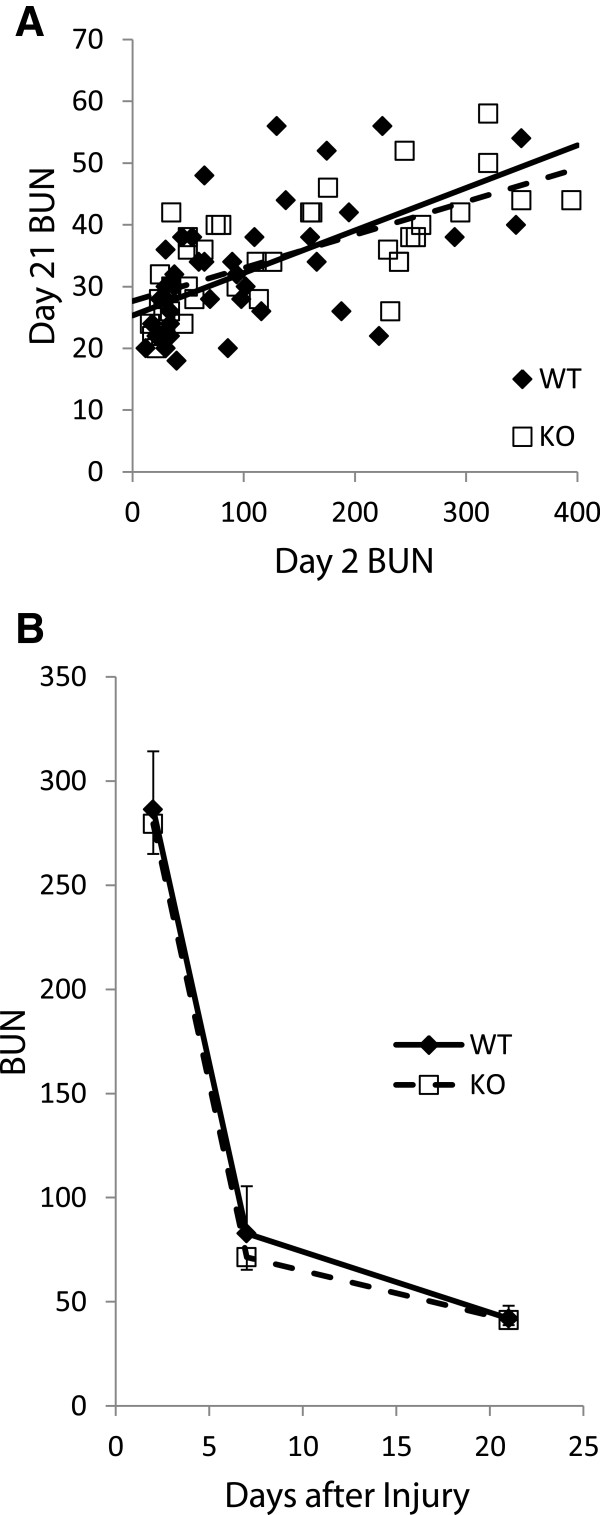
Figure 10.

Functional recovery following acute kidney injury. A. The BUN values at day 21 are plotted as a function of the BUN at day 2 for each mouse. Solid line represents linear regression for data from WT mice; dashed line for Clic4 null mice. The slopes of the lines are: WT 0.069 ± 0.015; KO 0.054 ± 0.009 (NS). B. Average BUN values for all mice with day 2 BUNs greater than 100 who survived to day 21. Standard errors are shown in only one direction to improve legibility. There is no significant difference between the average values at any time point.
