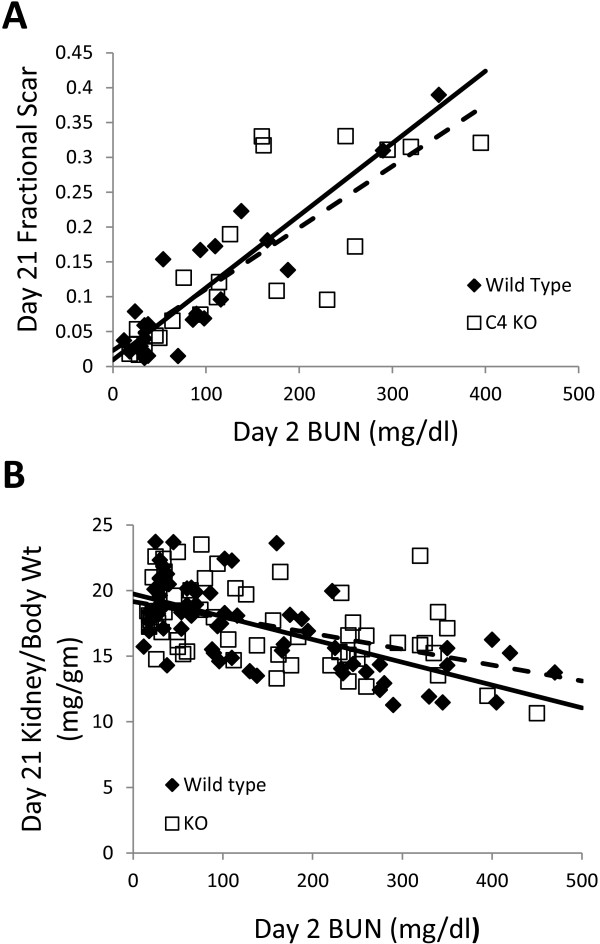
Figure 12.

Quantification of chronic scarring following acute injury. A. Fractional area of a central longitudinal kidney section stained blue by Mason’s trichrome is plotted as a function of the day 2 BUN. B. Ratio of day 21 total kidney mass to pre-injury body mass is plotted as a function of the day 2 BUN for each mouse. In both panels A and B, WT mice are represented by filled diamonds, Clic4 null mice by open squares. Solid line represents linear regression line for the WT, dashed line represents the linear regression line for the Clic4 null. See text for values and standard error of the slopes. The slopes of the linear regression lines are not different between the WT and Clic4 null mice in either graph.
