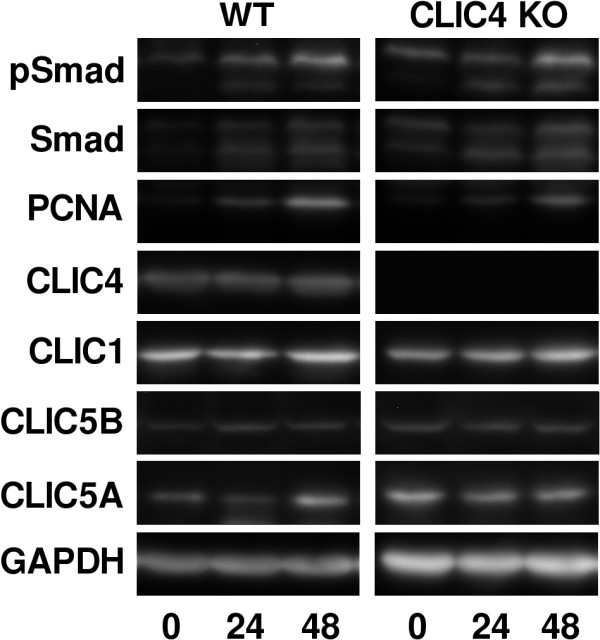
Figure 13.

Western blot images of SMADS, PCNA, and CLICs following acute kidney injury. Representative results from a single WT and Clic4 null mice from each time point are shown. The blots were sequentially stripped and probed with each antibody. In both the SMAD and PSMAD panels, the upper band represents SMAD2 and the lower band represents SMAD3.
