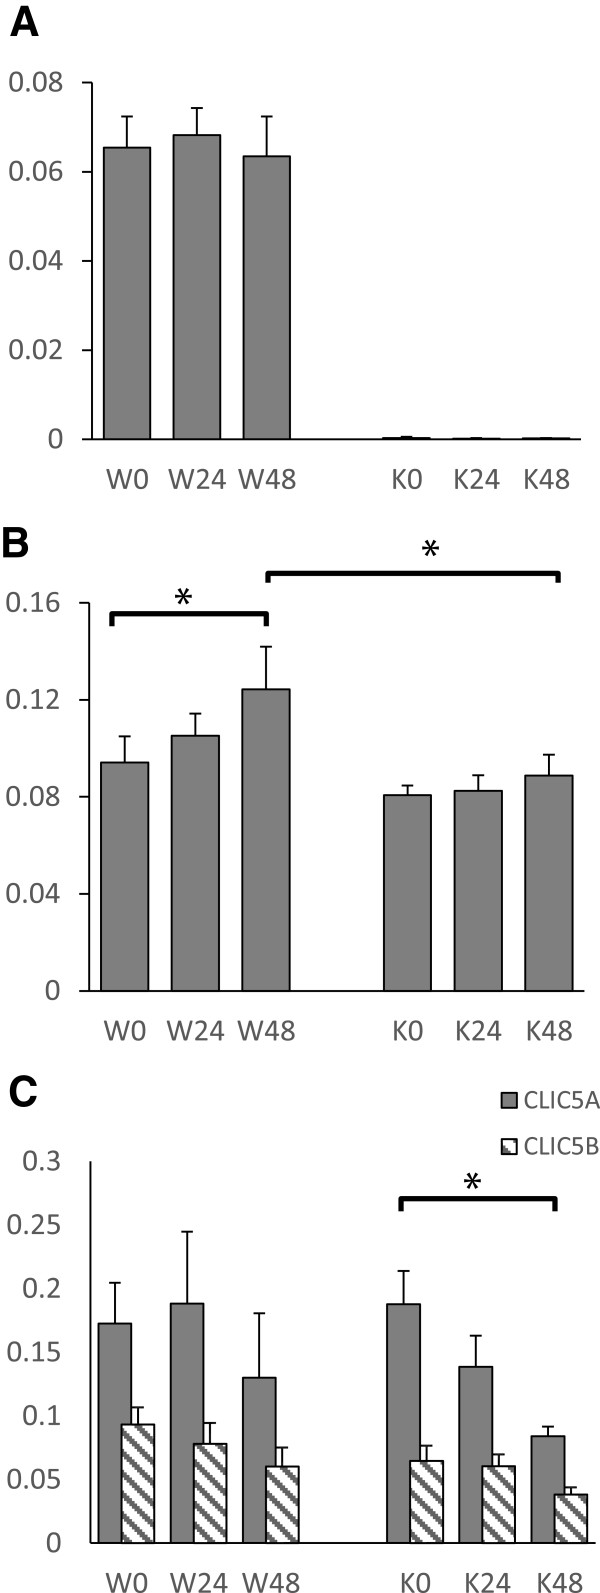
Figure 15.

Quantification of western blot signals for CLICs 1, 4, and 5. Digitized chemiluminescent signals for the CLICs were normalized to the GAPDH signal in the same sample and plotted as arbitrary units. Values from wild type (W) and Clic4 null (K) mice are shown at 0, 24, and 48 hours after folic acid injury as indicated. N = 8 for each group except for both 48 hour groups for which n = 7 (one mouse from each group was lost prior to analysis). A. CLIC4. B. CLIC1. C. CLIC5 A and B. CLIC5A is shown with the solid bars, CLIC5B with the hatched bars. Error bars indicate SEM. Asterisk indicates comparison with P < 0.05.
