Figure 2.

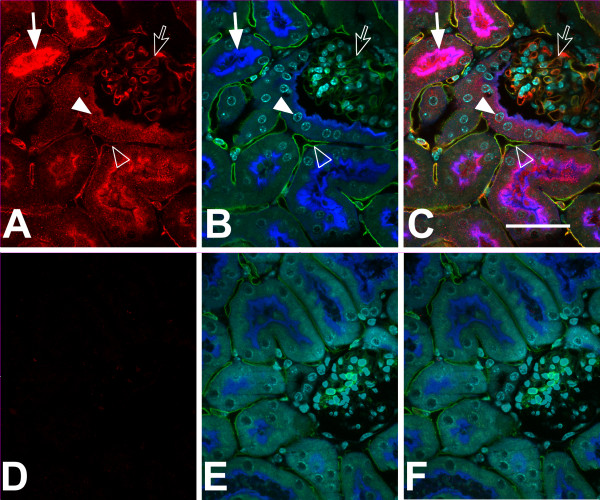
Immunolocalization of CLIC4 in mouse kidney, high power images. Vibratome sections stained with affinity-purified antibody to CLIC4 (red) plus markers for proximal tubule brush border (Lectin LTA, here shown in blue), endothelial cells (Lectin IB4, green), and nuclei (DAPI, cyan) were observed with a 60× objective under confocal microscopy. The upper set of images (A-C) are from a WT mouse, the lower set (D-F) are from a Clic4 null mouse. A and D (left): CLIC4 signal alone (red); B and E (center): merged image of the three markers (proximal tubule brush border in blue, endothelial cells in green, and nuclei in cyan); C and F (right): merged image of all signals. Solid arrow: colocalization of CLIC4 with LTA in proximal tubule brush border. Solid arrow head: CLIC4 signal in nucleus of a proximal tubule cell. Open arrow: colocalization of CLIC4 and IB4 in glomerular capillary loop. Open arrowhead: colocalization of CLIC4 and IB4 in peritubular capillary. Scale bar represents 50 microns.
