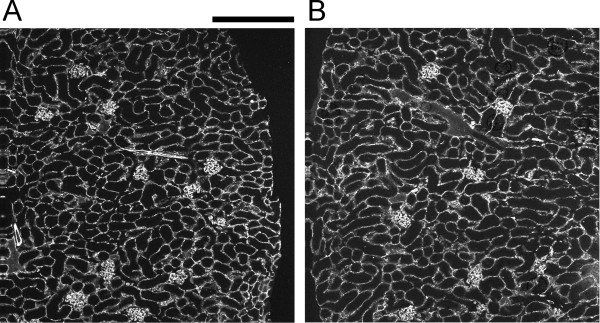
Figure 5.

Representative images of CD31-stained kidney sections used to generate the peritubular capillary density data. The fraction of the kidney cross sectional area stained for CD31 was determined after excluding glomeruli and large vessel. A. Section from a WT kidney. B. Section from a Clic4 null kidney. Scale bar represents 200 microns.
