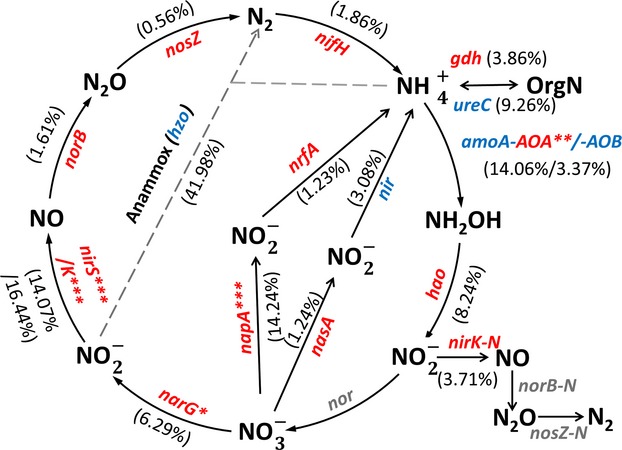
Figure 2.

The differences in abundance of N cycling genes in the shrubland and grassland. The percentages in brackets indicate changes in total abundances of functional genes between the shrubland and grassland sites. Red and blue colors represent the higher and lower total abundance when comparing the shrubland samples to the grassland samples, respectively. The gray-colored genes are not targeted by GeoChip 4.0. The differences between the shrubland and grassland sites were examined by two-tailed paired t-tests. “*” P < 0.10, “**” P < 0.05, “***” P < 0.01. nifH, dinitrogenase reductase; gdh, glutamate dehydrogenase; ureC, urease alpha subunit; amoA, ammonia monooxygenase alpha subunit; hao, hydroxylamine oxidoreductase; nirK, nitrite reductase; narG, nitrate reductase alpha subunit; nirS, nitrite reductase; norB, nitric oxide reductase; nosZ, nitrous-oxide reductase; hzo, hydra-zine oxidoreductase; nasA, assimilatory nitrate reductase large subunit; napA, periplasmic nitrate reductase large subunit; nrfA, nitrite reductase.
