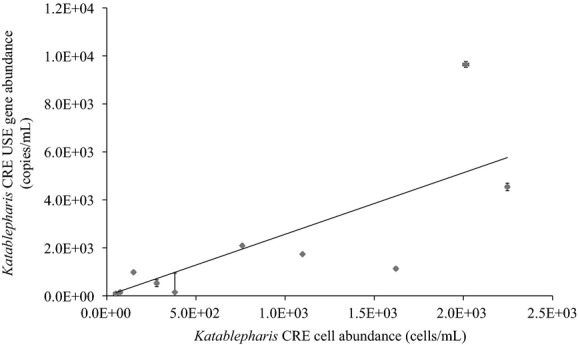
Figure 7.

Comparison of Katablepharis CRE abundance estimated by FISH and qPCR using probes specific for its Unique Sequence Element (USE) within the large subunit for both approaches. The x axis corresponds to numbers of cells estimated through FISH and the y-axis to LSU copies measured by qPCR. Regression with y-intercept set to zero was used to estimate gene copy number per cell, with a slope of 2.6 and an R2 value of 0.59. Horizontal and vertical error bars indicate standard deviation for abundance estimates by FISH and qPCR, respectively.
