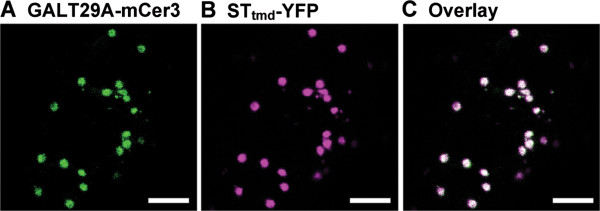
Figure 2.

Subcellular localization of AtGALT29A-mCer3 in N. benthamiana leaves. A-B: Confocal images of AtGALT29A-mCer3, STtmd-YFP (a Golgi marker) co-expressed transiently in N. benthamiana leaves. C: The overlay image of (A) and (B). The result indicates co-localization of ATGALT29A-mCer3 and STtmd-YFP in the Golgi apparatus. Scale bar = 5 μm.
