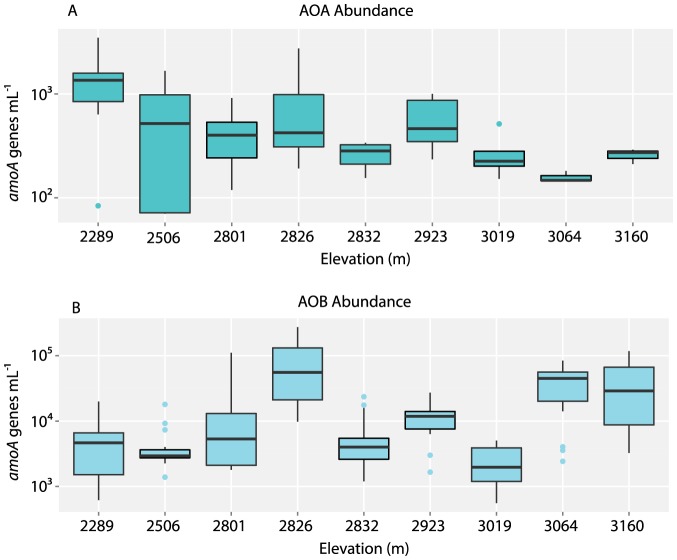
Figure 3. Boxplot comparison of number of amoA genes per milliliter (genes mL−1) for (A) ammonia-oxidizing archaea (AOA) and (B) ammonia-oxidizing bacteria (AOB).
The vertical axes (logarithimic scale) denote the number of genes mL−1; the horizontal axes represent the elevation of the sampling sites, and are ordered from lowest elevation (Harden Lake) to highest elevation (Upper Gaylor Lake). In these plots, the box denotes the mean plus and minus one standard deviation; the line within the box represents the median value; and lines extending above and below the box span the full range of the data. Outliers were defined as sample values 1.5 times larger than the upper quartile and are represented by green and blue circles.

