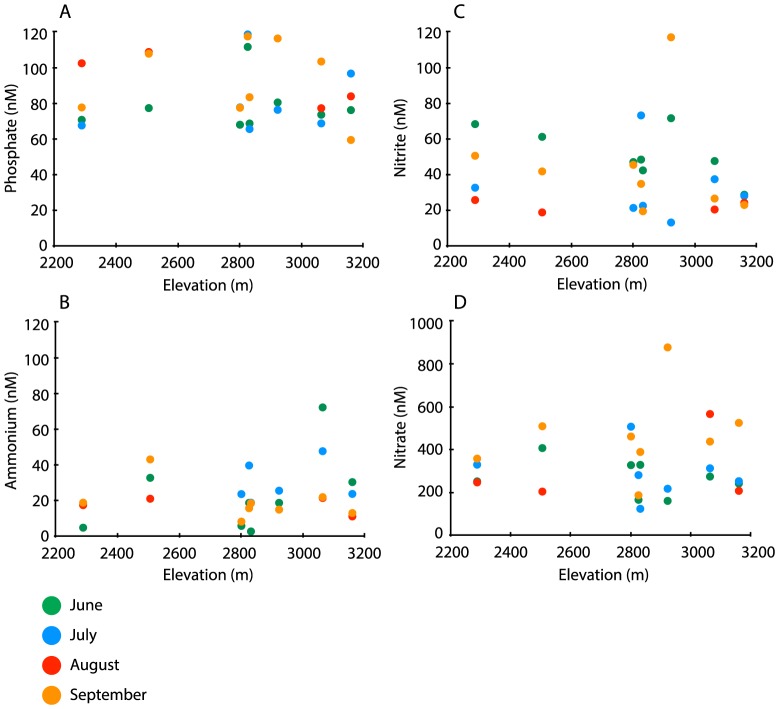
Figure 4. Variation in lake nutrient concentrations versus elevation for (A) phosphate (PO4 3-), (B) ammonium (NH4 +), (C) nitrite (NO2 -), and (D) nitrate (NO3 -).
Vertical axes show nutrient concentrations in nanomolar (nM) plotted on a logarithmic scale, and colors denote month of sampling. Note that some samples have highly similar nutrient concentrations and fall nearly on top of one another.

