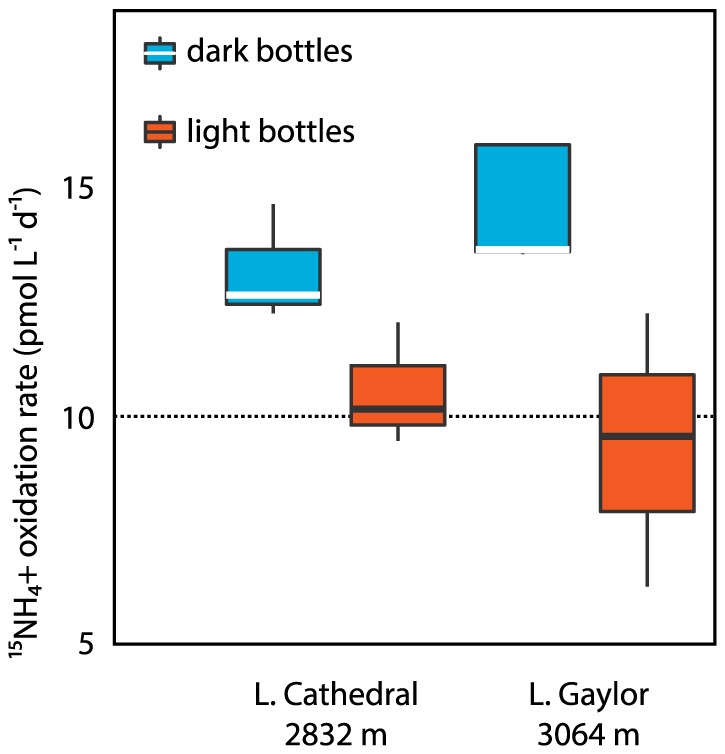
Figure 6. Boxplot comparison of calculated 15NH4 + oxidation rates measured in Lower Cathedral and Lower Gaylor lakes.

The vertical axis shows 15NH + oxidation rates (pmol L−1 D−1). The blue bars represent dark bottle incubations that were incubated under zero-light conditions, while the orange bars represent samples that were exposed to ambient light over a 24-hour cycle during in-situ incubation at the sampling site. The dashed line notes the detection limit. In these plots, the box denotes the mean plus and minus one standard deviation; the line within the box represents the median value; and lines extending above and below the box span the full range of the data.
