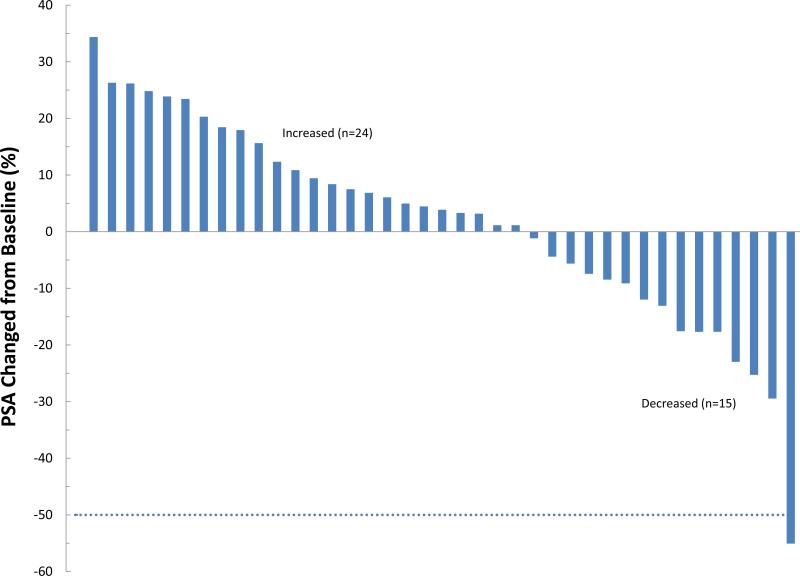
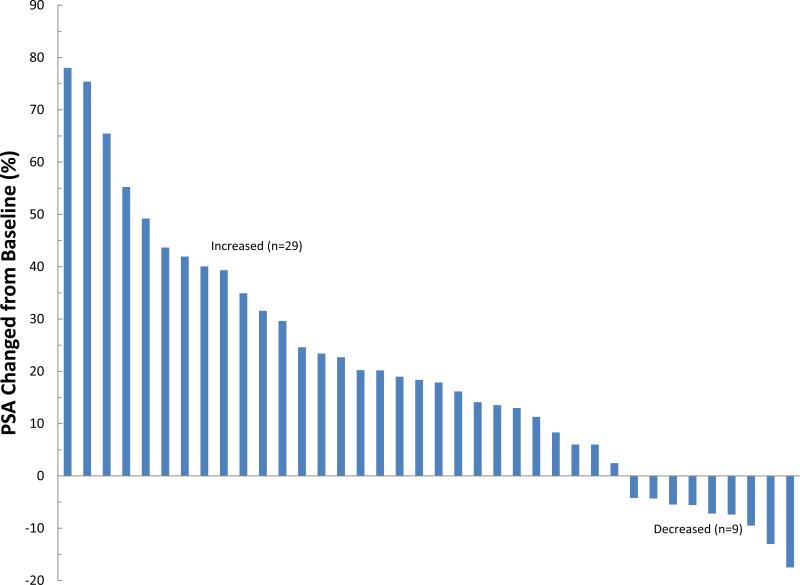
Figure 2. Waterfall plot of PSA changes during treatment with PHC in men with biochemically recurrent prostate cancer.
A) “best” change, which excludes a patient who came off study before completing one month due to intercurrent illness, and so was not evaluable and B) PSA change at 12 weeks. Changes are noted in percentage compared to baseline, not absolute PSA level changes.


