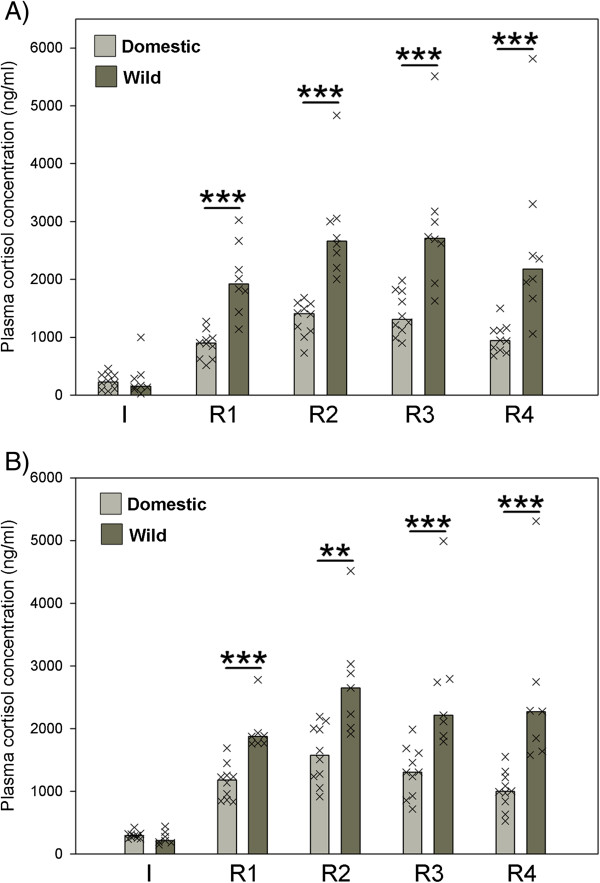
Figure 3.

Plasma cortisol response (ng/ml) in a stress reactivity test: initial values (I) and reaction values (R 1-4) of domestic guinea pigs and wild cavies during early (A) and late (B) adolescence. Bar charts represent medians and “X”s represent single individuals. Ndomestic = 10, Nwild = 8 (early adolescence) and Nwild = 7 (late adolescence); ** = p ≤ 0.01; *** = p ≤ 0.001. Comparison of guinea pig and cavy values was done with Mann-Whitney-U tests whereas development of cortisol values over time within guinea pigs and cavies was analysed with Friedman-tests and Kendall’s W for effect sizes. Friedman tests revealed a significant increase in cortisol values from I to the reaction values in both groups during both phases of adolescence. Guinea pigs: χ2 = 35.1, df = 4, p ≤ 0.001, W: 0.878 (early adolescence); χ2 = 34.96, df = 4, p ≤ 0.001, W: 0.874 (late adolescence). Cavies: χ2 = 21.8, df = 4, p ≤ 0.001, W: 0.681 (early adolescence); χ2 = 20.1, df = 4, p ≤ 0.001, W: 0.718 (late adolescence). p ≤ 0.001 for all Kendall W tests.
