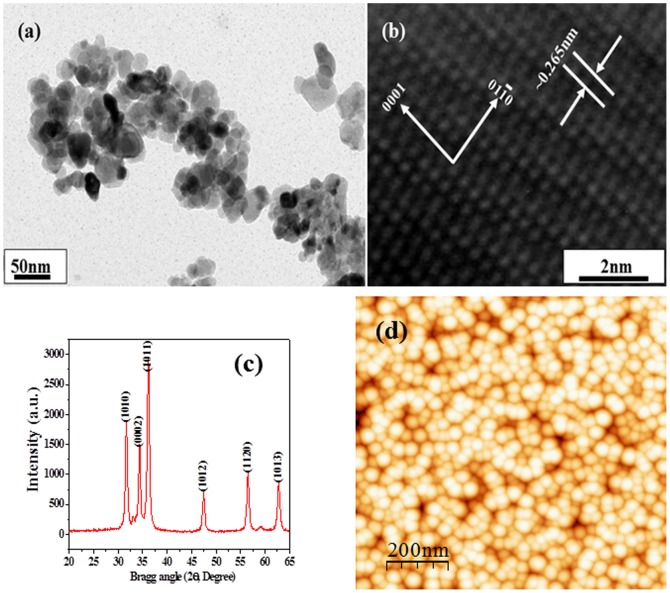
Figure 1.
(a) Shows the low magnification TEM image of the ZnO-NPs, (b) HR-TEM image shows the difference between two lattice fringes, which is about 0.265 nm and consistent with The HR-TEM observations, which indicate the crystallinity of the synthesized products. (c) Typical XRD pattern of grown ZnO-NPs. whereas (d) shows the AFM image of ZnO-NPs.

