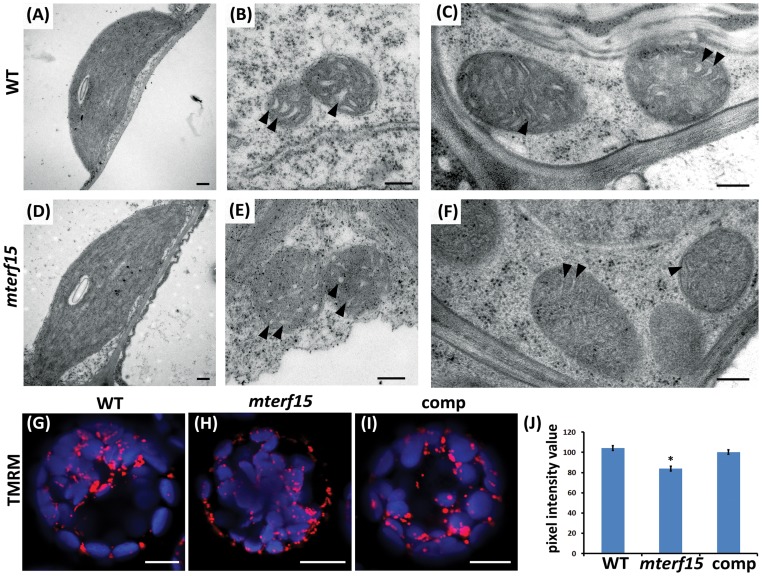
Figure 2. Morphological analysis of mitochondria in wild-type (WT) and mterf15 plants.
(A and D) Transmission electron microscopy of thin sections corresponding to chloroplasts from 1-month-old wild-type (A) and 2-month-old mterf15 plants (D). Sections were processed by chemical fixation. Scale bar = 2 µm. (B, C, E, F) Transmission electron microscopy of thin sections corresponding to mitochondria from wild-type (B, C) and mterf15 (E, F) plants. Images B and E correspond to chemically fixed leaves. Images C and F correspond to leaves fixed by high-pressure freezing. Scale bar = 1 µm. Arrowheads pointed the inner membrane spaces in mitochondria. (G, H, I) Overlay of signals from chlorophyll autofluorescence (blue) with signals from the mitochondrial membrane potential marker tetramethylrhodamine methyl ester perchlorate (TMRM; red) in protoplasts from the wild-type (G), mterf15 (H) and complementation lines (I). Scale bar = 10 µm. (J) Quantification of the mean fluorescent intensity after TMRM staining. Data are mean ± SD of 15 individual protoplasts from the wild-type, mterf15 and complementation lines. Asterisks represent significant differences (*P<0.5, **P<0.01, ***P<0.001; Student's t test) relative to wild type.

