
Fig. 2.
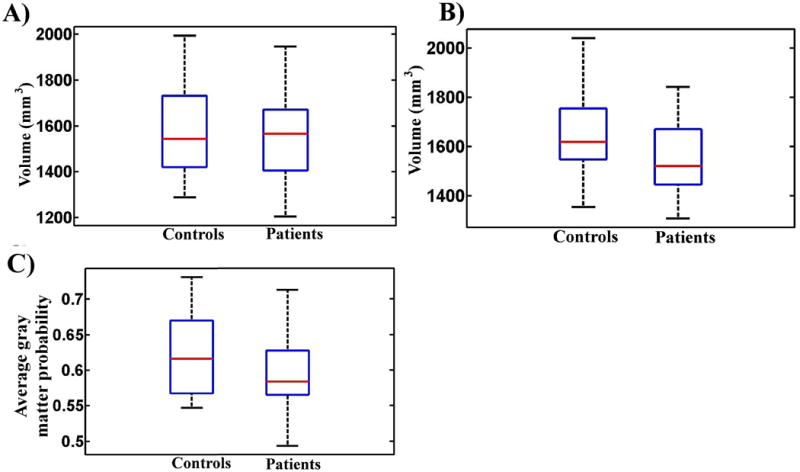
Box-plots comparing amygdala neuroanatomical features between patients and controls. (A) Control and patient groups did not differ significantly in the left amygdala (controls > patients, p = 0.2344; patients > controls, p = 0.7656). (B) Control group had significantly larger volumes in the right amygdala (p = 0.0452) based on a two group independent t-test. Volumetric measurements were extracted using the Freesurfer version 4.5 (http://surfer.nmr.mgh.harvard.edu/). (C) Controls had significantly higher average gray matter probability values in the bilateral amygdala as compared to patients (p < 0.0001).