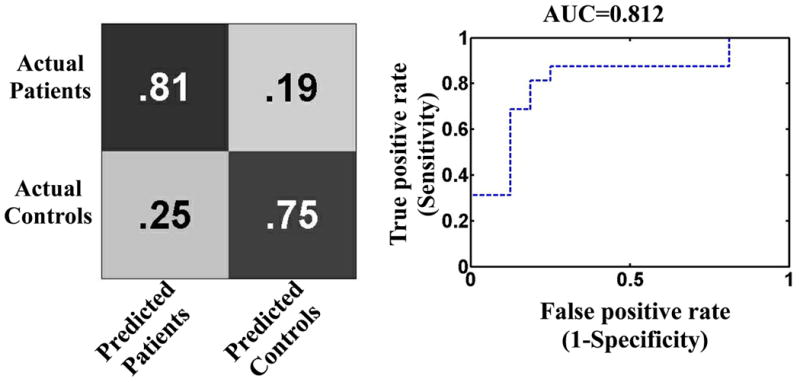
Fig. 3.

A confusion matrix and a receiver operating characteristic curve (ROC) which were used to compute the model accuracy, sensitivity, specificity, and area under the ROC (AUC). The accuracy, sensitivity, specificity, positive predictive value, and negative predictive value were 78.12%, 81.25%, 75.0%, 76.47%, and 80.0%, respectively. Predictions were significant at p = 0.0014.
