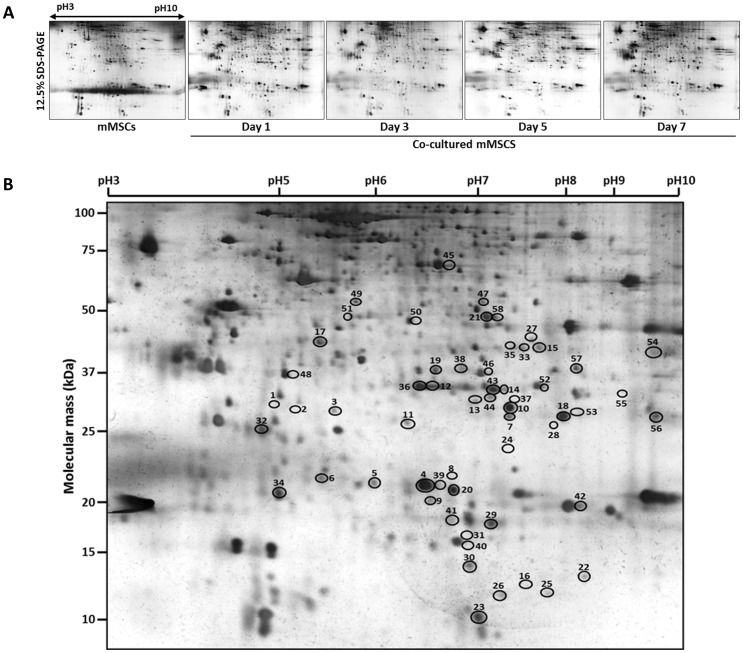
Figure 3. Two-dimensional gel electrophoresis images and spot analysis revealed 58 differentially expressed proteins.
A) Following the co-culture of mMSCs with pSGCs for 1, 3, 5 and 7 days, total cell lysates (200 µg) were separated on pH 3–10 linear IPG strips in the first dimension and 12.5% SDS-PAGE in the second dimension. The gels were stained with mass spectrophotometry-compatible silver staining kit. B) According to the data analyses, expression levels of 58 spots (circled) were significantly altered at least by 1.5 fold (p<0.05, one-way ANOVA with Bonferroni post-hoc test). Each of these spots has a specific spot number for database storage and further analysis. Data from five independent experiments (Five gels in duplicate for each time point) were analyzed and the gel figure presented here is from day 7.

