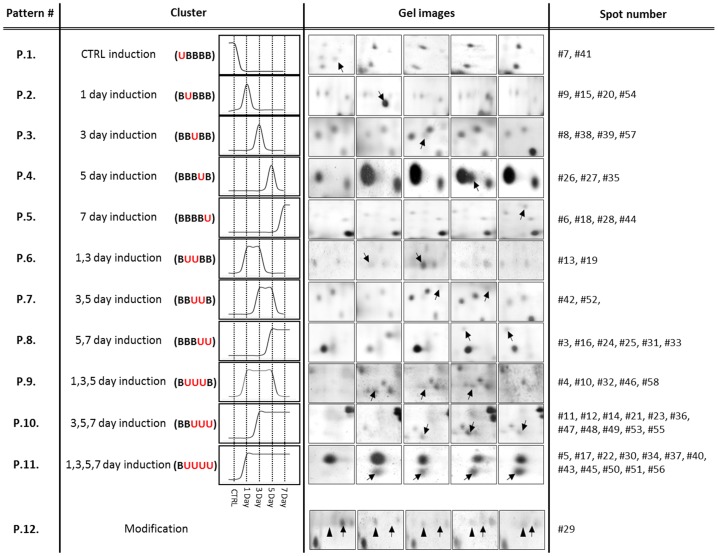
Figure 4. Categorization of 58 spots based on temporal expression profiles.
Fifty-eight spots were grouped based on their temporal expression patterns following spot analysis for each time point (B: basal expression; U: up-regulation; M: modification). All identified spots in 2-DE gel are categorized into 12 patterns based on their expression profiles (p<0.05, one-way ANOVA). The examples of spots corresponding to the expression pattern or profile were shown. Black arrows indicate up-regulated spots at each time point. In the pattern #12, black arrows indicate spot was shifted into a different pH location on gels as the culture progresses. Arrowheads indicate increased expression of the same protein during co-culture.

