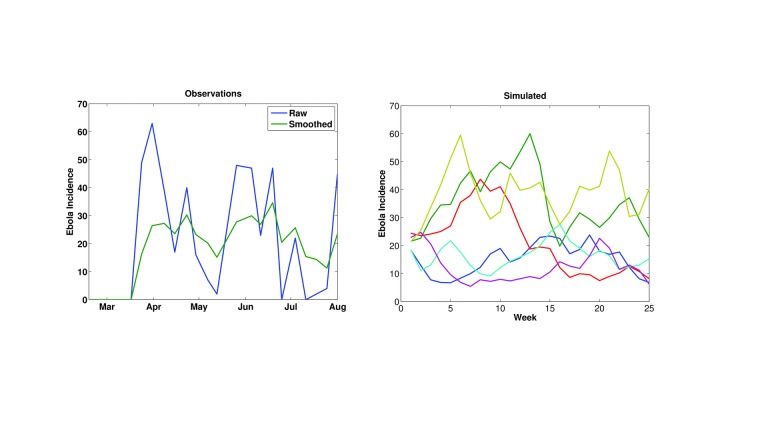
The erratic time series of Ebola incidence data.
Left) Time series of WHO Ebola incidence in Guinea for mid-February through July 2014. Raw incidence (blue) and 3-week smoothed incidence (green) are shown. Right) Simulated incidence using the SEIRX model (Equations 1-5) and stochastic variation of R0 (Equation 6). 6 different integrations are shown; all generated with the following initial conditions and parameters: N = 200,000 persons; S(0) = 199,950 persons; E(0) = 25 persons; I(0) = 25 persons; η = 0.5; Z = 8 days; D = 10 days; M = 8 days; α = 0.1/day.

