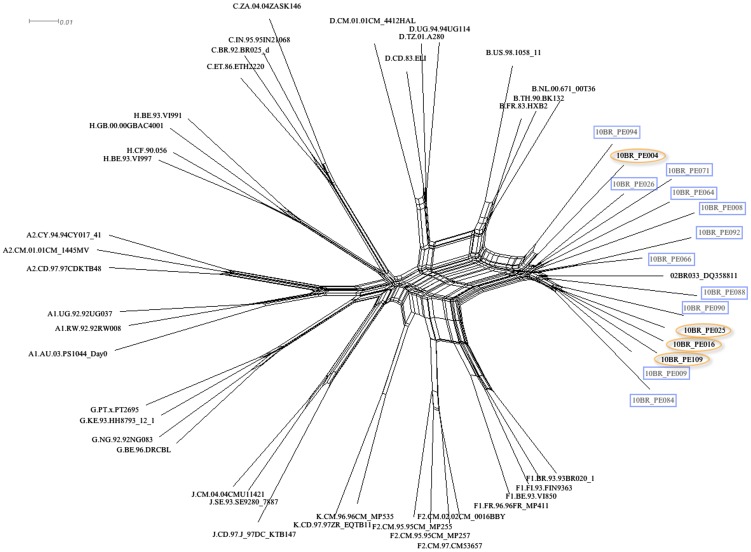
Figure 4. Split networks for four sequences of CRF_70BF1 (marked with orange circles) and eleven CRF_71BF1 (marked with blue boxes) and representatives of HIV subtypes A–K sequences from the Los Alamos database (http://hiv-web.lanl.gov).
The splits graphs used distances computed under the GTR+I+G model. The scale bar represents 0.01 nucleotide substitution per site. The results demonstrate that sequences within each of CRF did not group directly with each other, but they were present as one group of sequences within a cluster between subtype B and subclade F1.

