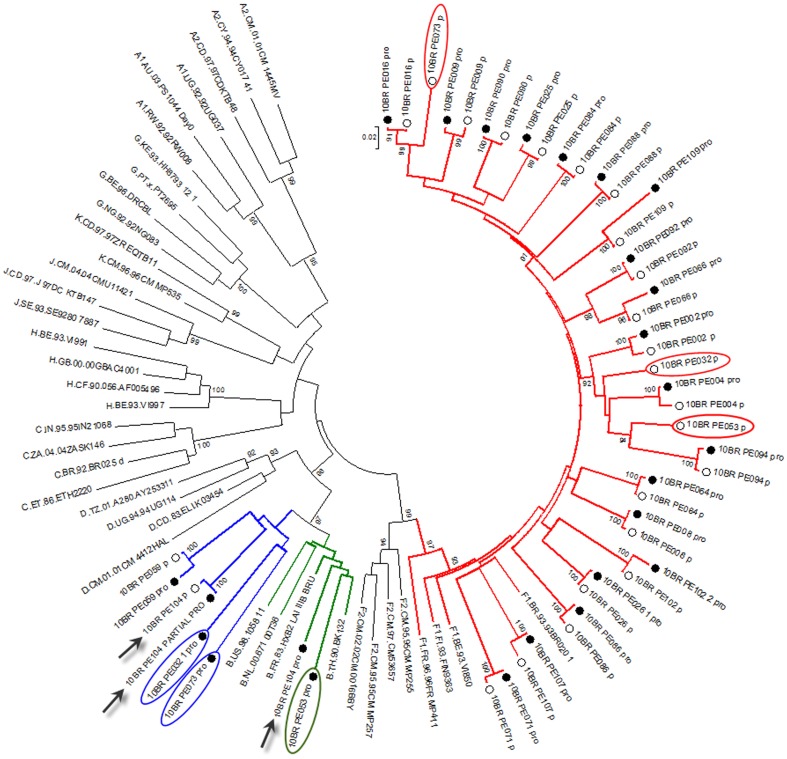
Figure 6. Comparison of phylogenetic clustering profile of sequences from both plasma (empty circles) and provirus (black circles) and other HIV-1 reference sequences from the Los Alamos HIV-1 database representing 11 genetic subtypes.
Viral sequences from both compartments were aligned with the complete set of reference sequences obtained from the Los Alamos database (http://hiv-web.lanl.gov). Green, blue and red colored branches represent subtype B, BF1 recombinants, and subclade F1, respectively. Sequence with discordant results between PBMCs and plasma are marked with blue and red oval circles, respectively. For purposes of clarity, the tree was midpoint rooted. The approximate likelihood ratio test (aLRT) values of ≥90% are indicated at nodes. The scale bar represents 0.02 nucleotide substitutions per site. Except subjects 10BR_PE073, 10BR_PE053, 10BR_PE104 and 10BR_PE032, each patient forms a tight cluster and is distinct from other subjects with aLRT SH-like supports >95% for all inter-subject clusters. The results from the ML analysis added further support to the results depicted in figure and were sufficiently robust to confirm the event of dual infection with different subtype. In case 10BR_PE104 (indicated by black arrow), MPS data revealed the existence of subtype B NFLGs and a second BF1 recombinant strain almost identical to the plasma virus in the same region.

