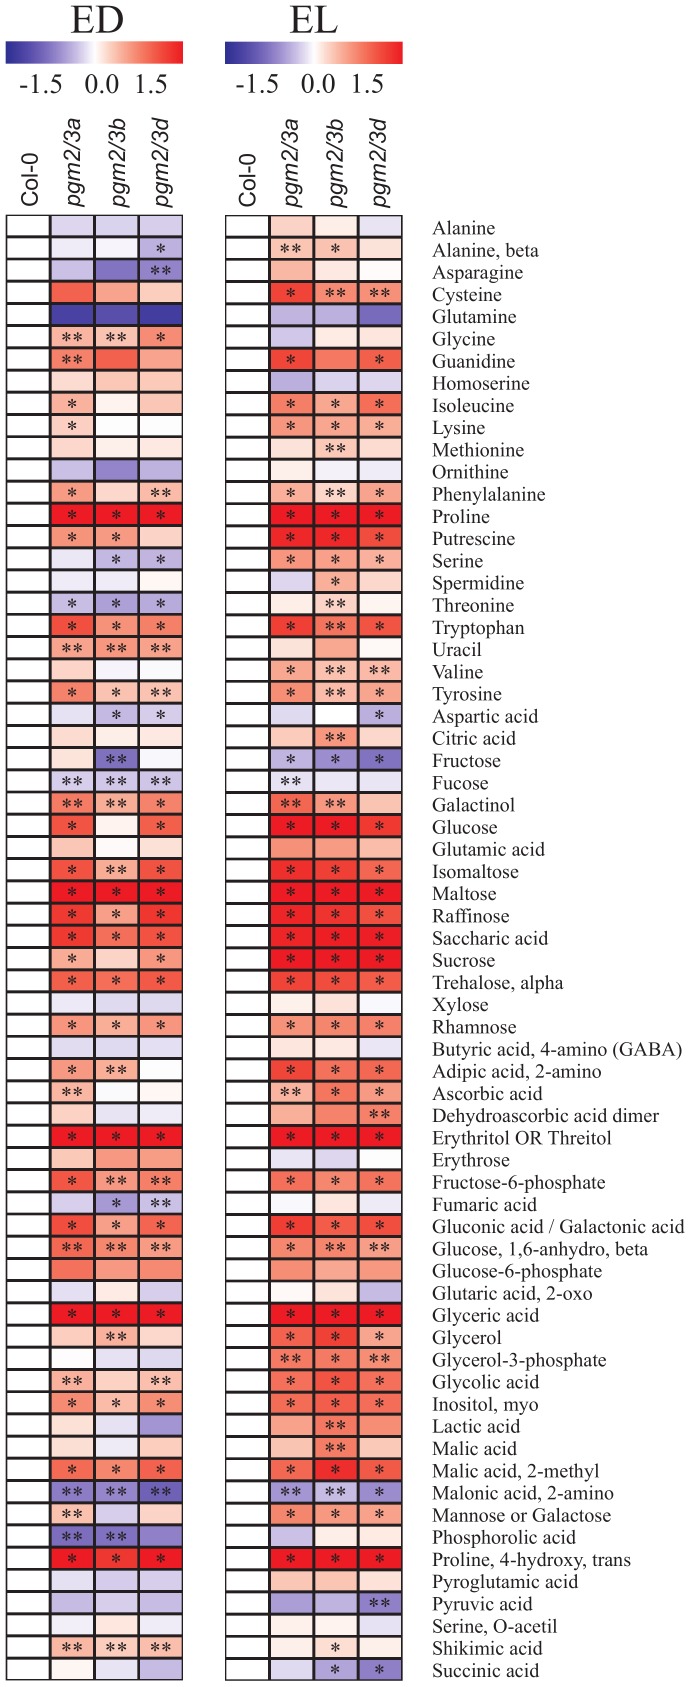
Figure 3. Overlay heat map of the metabolite changes in pgm2/3 mutants in comparison with control (Co1-0) using false-color scale.
Red or blue indicate that the metabolite content is increased or decreased, respectively. Five-week-old plants were grown under 12 h light/12 h dark conditions and harvested at the end of light phase (EL) and dark phase (ED), and three replicates represented 3–4 plants were analyzed (two technical replicates each); asterisks denote the significance levels as comparing pgm2/3 mutants to Co1-0 : * p≤0.01;** p≤0.05.

