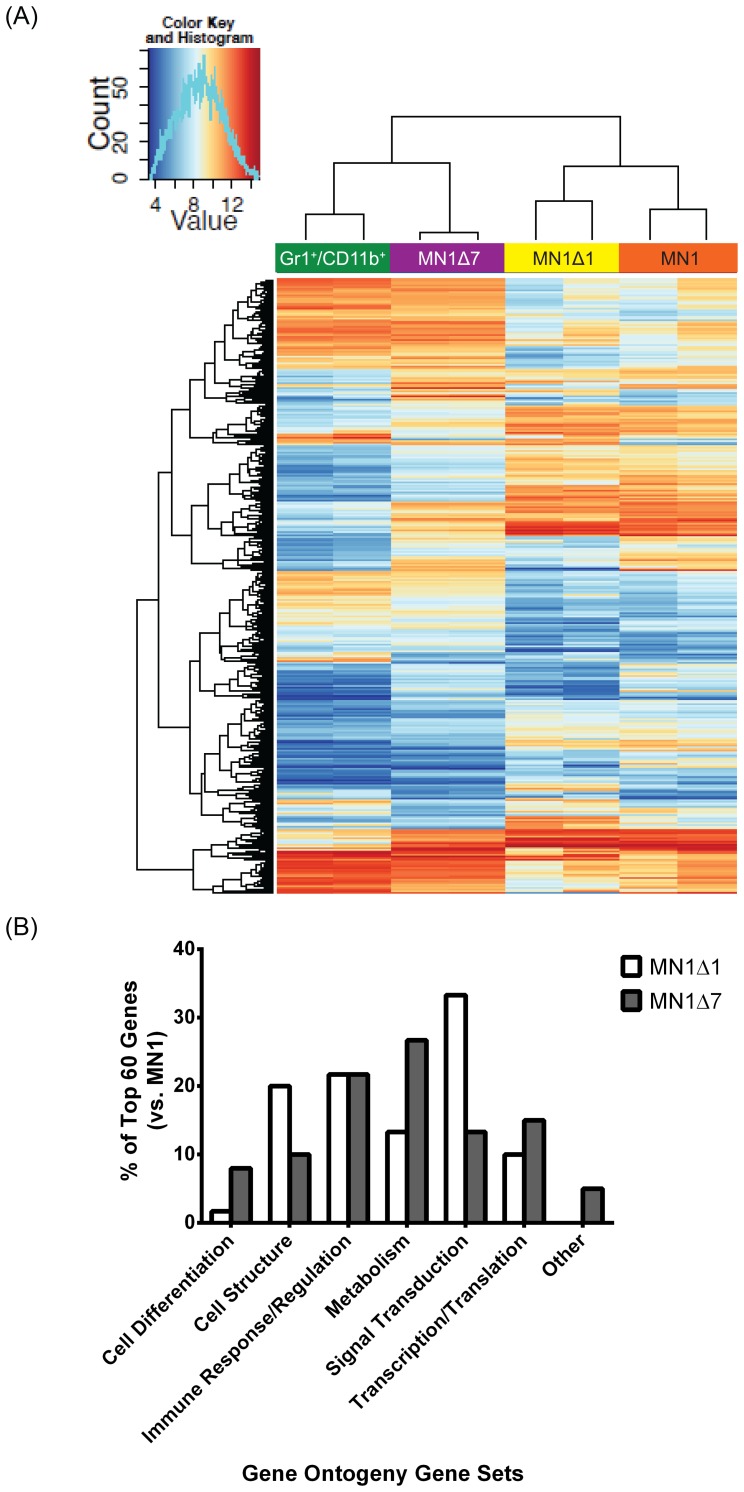
Figure 4. Hierarchical clustering of cells with N- and C-terminally deleted MN1.
(A) Heat map of differentially regulated pathways for enhanced proliferation and blocked differentiation. (B) Comparison of top 60 enriched gene ontology gene sets for the comparison of MN1Δ1 and MN1Δ7 with wildtype MN1.

