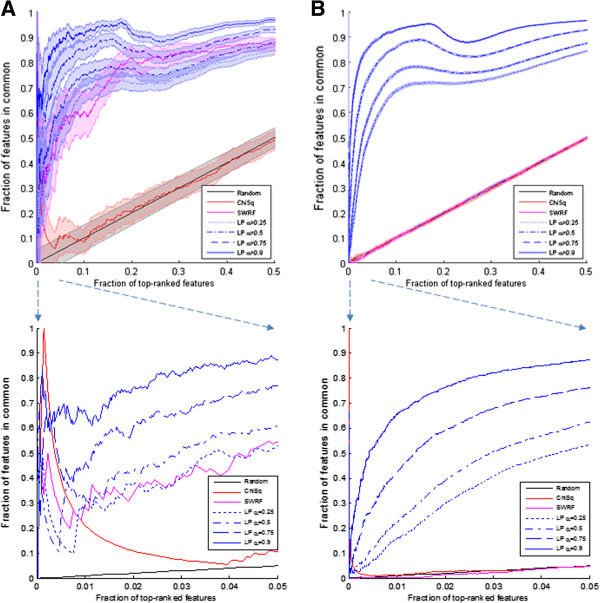
Figure 4.

Reproducibility curves of top-ranked features shown for top 50% of features (95% confidence interval), with callout for top 5% of features (CI omitted for clarity). The x-axis shows the fraction of top-ranked features being considered, and the y-axis shows the fraction of features in common to rankings obtained from each of the two datasets independently (TGen and ADRC). The datasets used are: A) small-scale TGen and ADRC overlap data (chr19, 1,307 SNPs); B) genome-wide TGen and ADRC overlap data (chr 1–22, 64,984 SNPs). For this plot, the chi squared and SWRF methods are virtually indistinguishable from the random performance curve along the diagonal. SLR is omitted because it selects less than 0.5% of features with almost no reproducibility.
