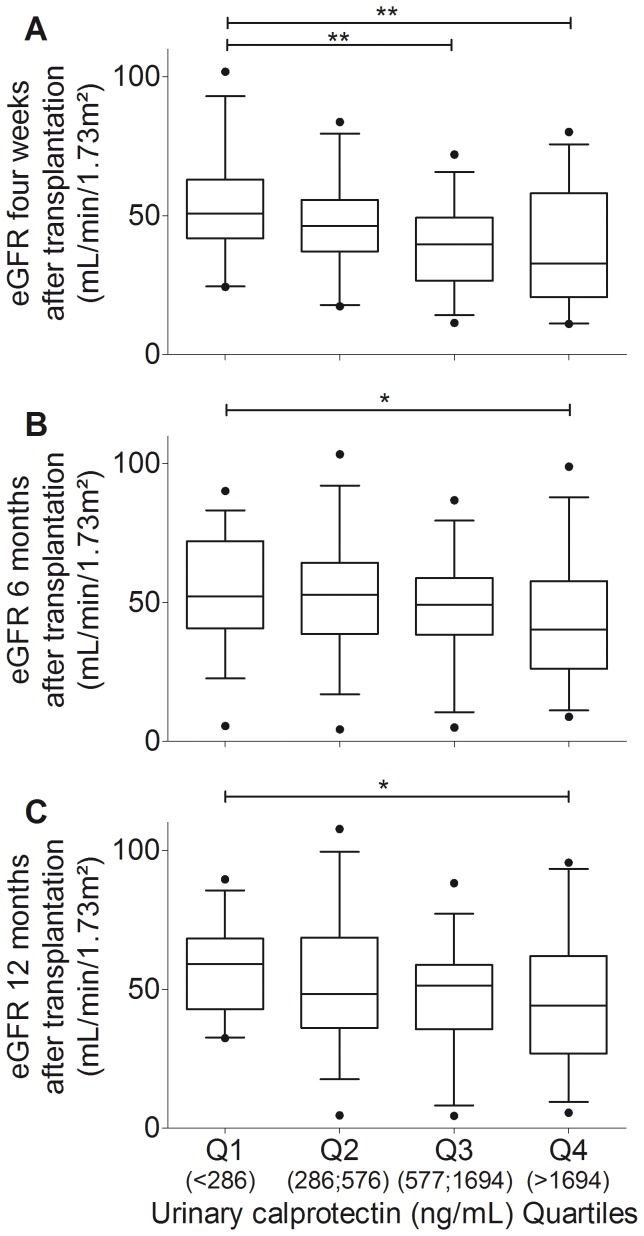
Figure 1. Urinary calprotectin concentrations predict renal allograft function.
Box-and-whiskers-plots showing the reduction of estimated glomerular filtration rate (eGFR) four weeks (A), 6 months (B; n = 135), and 12 months (C; n = 123) after transplantation with increasing quartiles (Q) of urinary calprotectin concentrations. Boxes indicate median and interquartile ranges, whiskers indicate 5 to 95 percentile. Significant differences between the shown groups were **P<0.01 and *P<0.05 by Kruskal-Wallis test and Dunn’s multiple comparison test.

