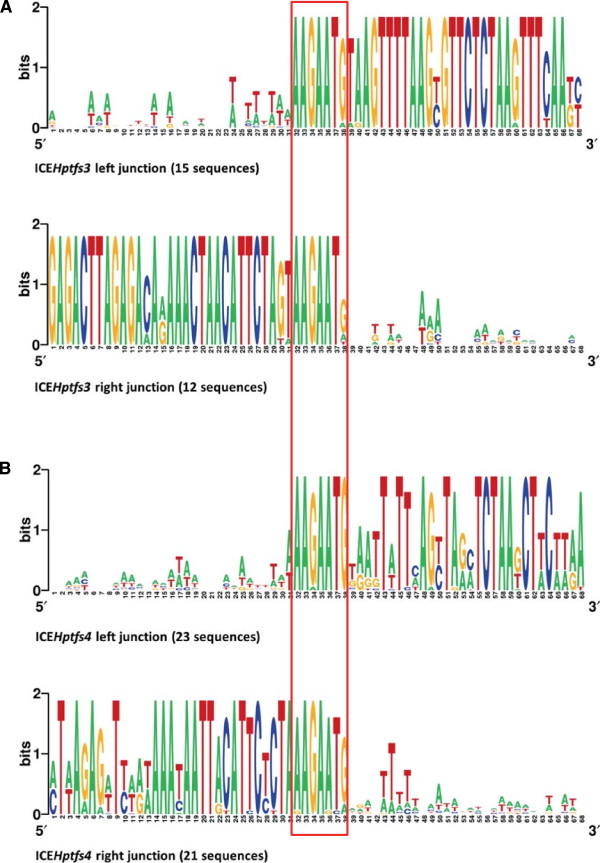
Figure 5.

Comparative analysis of integration sites. Sequence logos for nucleotide sequences around ICEHptfs3(A) or ICEHptfs4(B) integration sites were generated using Weblogo [43]. The level of sequence conservation is indicated by the height of the letters (with a maximum of 2 bits at each position).
