
Figure 4.
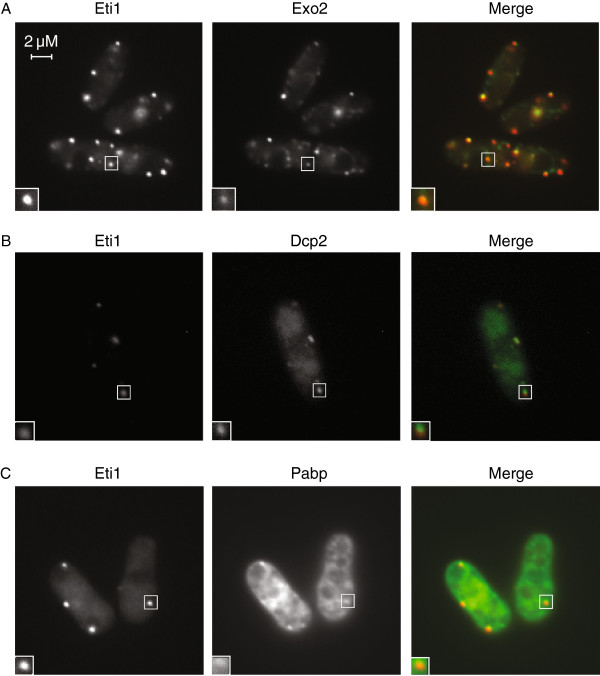
Exo2 and Eti1 proteins colocalize in stress granules. (A) Cells expressing Eti1-mCherry (left) and Exo2-GFP (centre) were imaged 1 hour after glucose removal. The right panel shows a merge or both images, with Eti1-mCherry in red and Exo2-GFP in green. (B) As A, but cells expressing Eti1-mCherry and Dcp2-CFP as indicated. (C) As A, but cells expressing Eti1-mCherry and Pabp-GFP as shown in the figure.