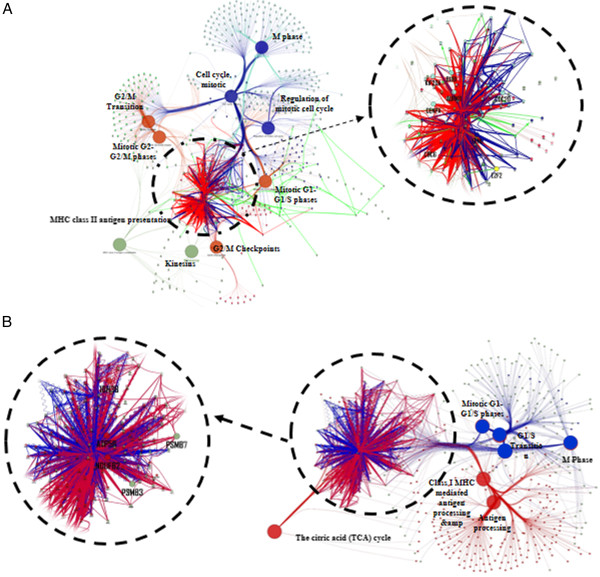
Figure 4.

Differentially activated pathways features between Type I and Type II ECs subtypes in (A) the cell‒cycle regulator network and (B) the antigen processing network. Color arrows reflect pathway differences between subtypes (blue: Type I, red: Type II). Green lines represent activation. A zoomed in view of the cancer hub gene signatures are also shown.
