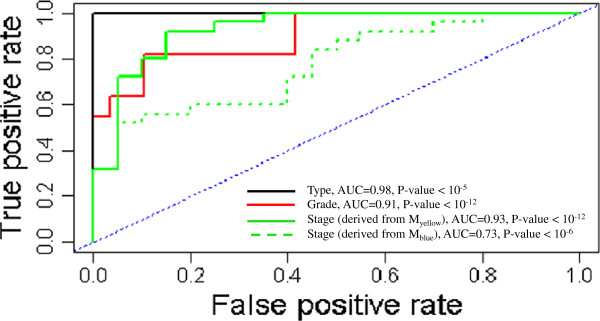
Figure 5.

ROC curve to assess the accuracy of the cancer hub genes signature in the independent dataset. True positive rate represent the model sensitivity, whereas false positive rate is one minus the specificity or true negative rate and represents chance.
