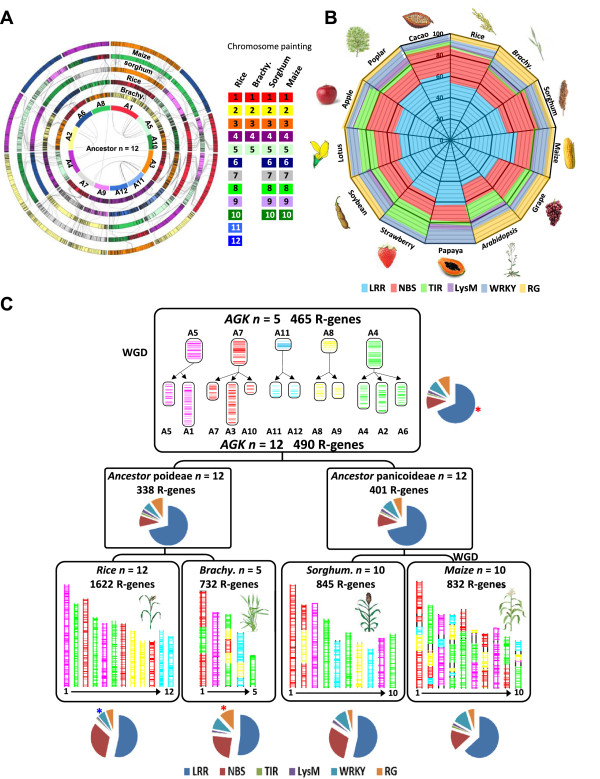
Figure 1.

R-genes conservation and evolution in plants. (A) Grass genome synteny is illustrated as concentric circles. The chromosomes are highlighted with a color code (right) that illuminates the n = 12 monocot ancestral genome structure (inner circle A1 to A12). Any radius of the circle shows orthologous chromosomes between Brachypodium, rice, sorghum, and maize genomes. Maize genome is depicted as a double circle originating from the maize-specific recent WGD. Colinear R-genes are linked with black lines between circles, and ancestral duplicated R-genes are linked with black lines at the center of the circle. (B) R-genes content from 13 plant genomes including monocots (rice, Brachypodium, sorghum, and maize) and eudicots (Arabidopsis, Grape, Cacao, Papaya, Strawberry, Poplar, Lotus, Apple, and Soybean). The color code (bottom) highlights the R-gene classes investigated (LRR, NBS, TIR, LysM, RG). (C) Evolutionary scenario of R-genes in monocots. The modern grass genome structures (bottom) are depicted with a five-color code that illuminates their relationship with the n = 5 (A5, A7, A11, A8, A4) and n = 12 (A1 to A12) ancestors (top), according to Murat et al. [67]. The characterized R-genes are illustrated as vertical bars on the chromosomes of modern and ancestral genomes. The percentages of R-gene classes (LRR, NBS, TIR, LysM, RG, highlighted with the color code legend at the bottom) are shown with circular distributions for the four monocot genomes (bottom), the rice/Brachypodium and sorghum/maize ancestral genome intermediates (center), as well as for the ancestral karyotype (top). Statistically enriched and impoverished R-gene families are illustrated respectively with red and blue dots on the circular distributions.
